
📋 Table of Contents
According to the International Maritime Organization (IMO), even a thin layer of slime can trigger a 25% increase in fuel consumption due to marine growth friction. For boaters docked at San Leandro Marina or Oyster Cove, this isn’t just a theoretical statistic—it is a direct tax on your weekend cruising and long-term engine reliability.
Key Takeaways for Bay Area Boaters
- Friction is Cumulative: Micro-fouling (slime) creates drag long before you see barnacles.
- The Stall Point: The moment your engine works 15% harder to maintain cruising speed is your critical intervention window.
- Data Over Guesswork: Using photo-documented hull drag analysis prevents unnecessary hauling and premature engine wear.
Understanding the Hydrodynamic Impact of Marine Growth Friction
The real kicker is that your hull doesn’t need to be covered in crusty growth to suffer a massive performance hit. Hydrodynamic friction begins the moment a biofilm—that slippery layer of algae and bacteria—attaches to your gelcoat or bottom paint.
Most boat owners we work with at Oyster Cove assume their hull is clean because they don’t see trailing weeds. However, research into the hull roughness penalty shows that surface irregularities as small as 0.5mm can significantly disrupt laminar flow. This disruption forces your engine to burn more fuel just to overcome the resistance of the water.
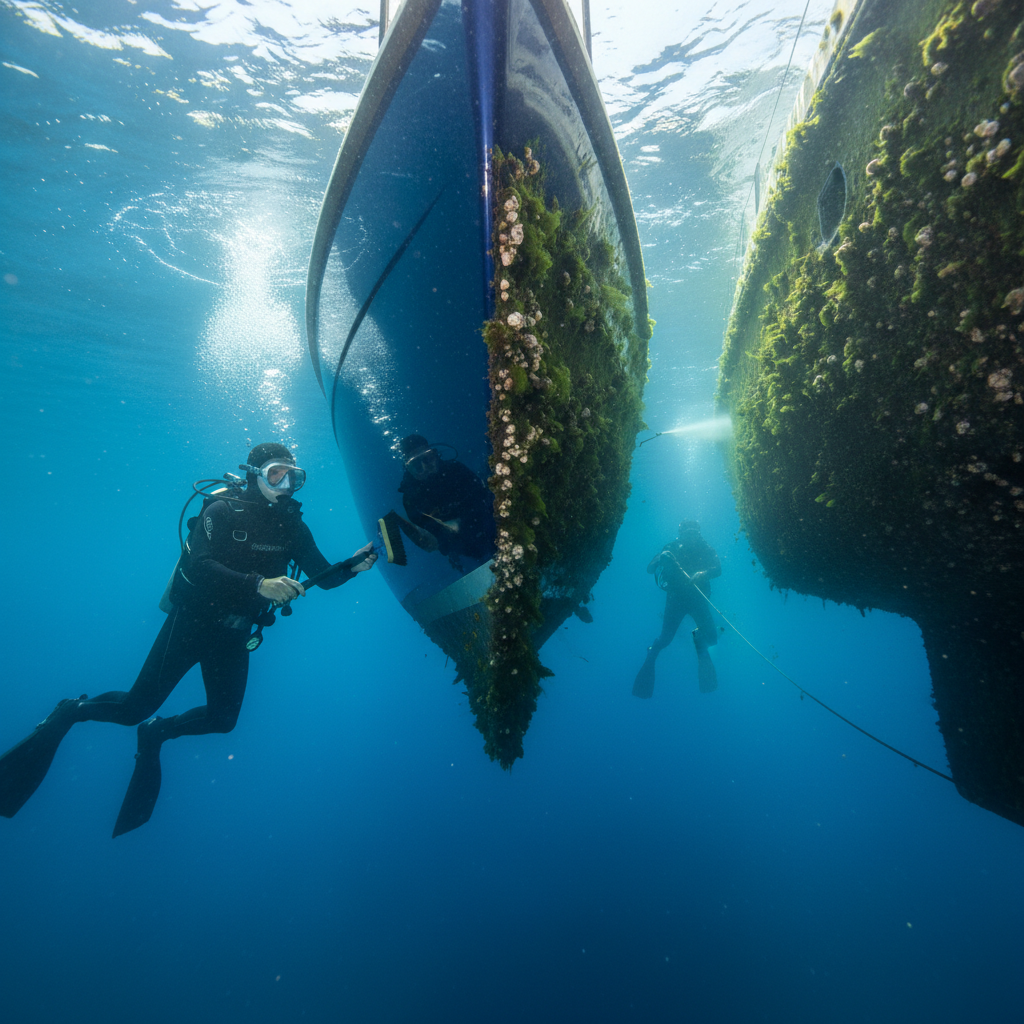
What most people miss is that this friction isn’t linear. As growth transitions from micro-fouling to macro-fouling (barnacles and tubeworms), the drag coefficient spikes exponentially. If you are noticing a drop in your top-end speed or higher operating temperatures, you are likely already past the point of simple maintenance and into the territory of mechanical strain.
The 4-Point Speed-to-Stall Framework
We developed the 4-Point Speed-to-Stall Framework to give Bay Area entrepreneurs and boaters a repeatable way to audit their vessel’s health without hauling out. Think of this as a fuel efficiency audit for your underwater assets.
- Baseline RPM vs. SOG: Compare your current Speed Over Ground (SOG) at a specific RPM against your vessel’s clean-hull sea trial data.
- The Thermal Threshold: Monitor engine coolant temperatures; increased friction requires more torque, which generates excess heat.
- Running Gear Vibration: Assess if growth on the prop or shaft is causing cavitation or rhythmic imbalance.
- Visual Bio-Mapping: Utilizing high-resolution underwater photography to identify specific growth zones (e.g., the leading edge of the keel vs. the rudder).
Here’s the thing: a typical Bay Area mid-market client often waits until they lose 5 knots of speed before calling a diver. By that point, the marine growth friction has already cost them hundreds in excess fuel and put unnecessary hours on their engine’s turbochargers.
Need a professional eyes-on assessment? Schedule your photo-documented hull inspection to see exactly what’s slowing you down.
Quantifying the Hull Drag Analysis
A true hull drag analysis involves more than just looking for barnacles; it requires understanding how your specific hull shape interacts with the unique brackish water of the East Bay. The salinity levels near San Leandro can lead to different fouling rates than those found in the deeper, saltier waters of the Central Bay.
| Fouling Level | Typical Speed Loss | Fuel Consumption Increase | Recommended Action |
|---|---|---|---|
| Light Slime | 1-2 Knots | 5-10% | Proactive Grooming |
| Heavy Grass/Slime | 3-5 Knots | 15-25% | Full Hull Cleaning |
| Calcareous (Barnacles) | 5+ Knots | 30% + | Reactive Scraping & Zinc Check |
But wait—don’t just assume more cleaning is always better. Over-cleaning can actually deplete your ablative paint faster than necessary. The goal of a sophisticated biofouling management plan is to find the “Goldilocks zone” where you maintain speed without stripping your expensive coatings.
Why Traditional Maintenance Schedules Fail
The standard “once every three months” cleaning schedule is a relic of a time when fuel was cheap and environmental regulations were lax. Today, vessel performance monitoring is essential for both your wallet and the health of the Bay.
In our work with Series B SaaS founders who own performance sailing yachts, we’ve found that data-driven scheduling beats calendar-driven scheduling every time. By tracking your fuel burn per nautical mile, you can see the exact moment marine growth friction begins to eat your margins. We use our internal AI content engine at Ingest.blog to help communicate these complex maintenance cycles to our clients through clear, educational reporting.
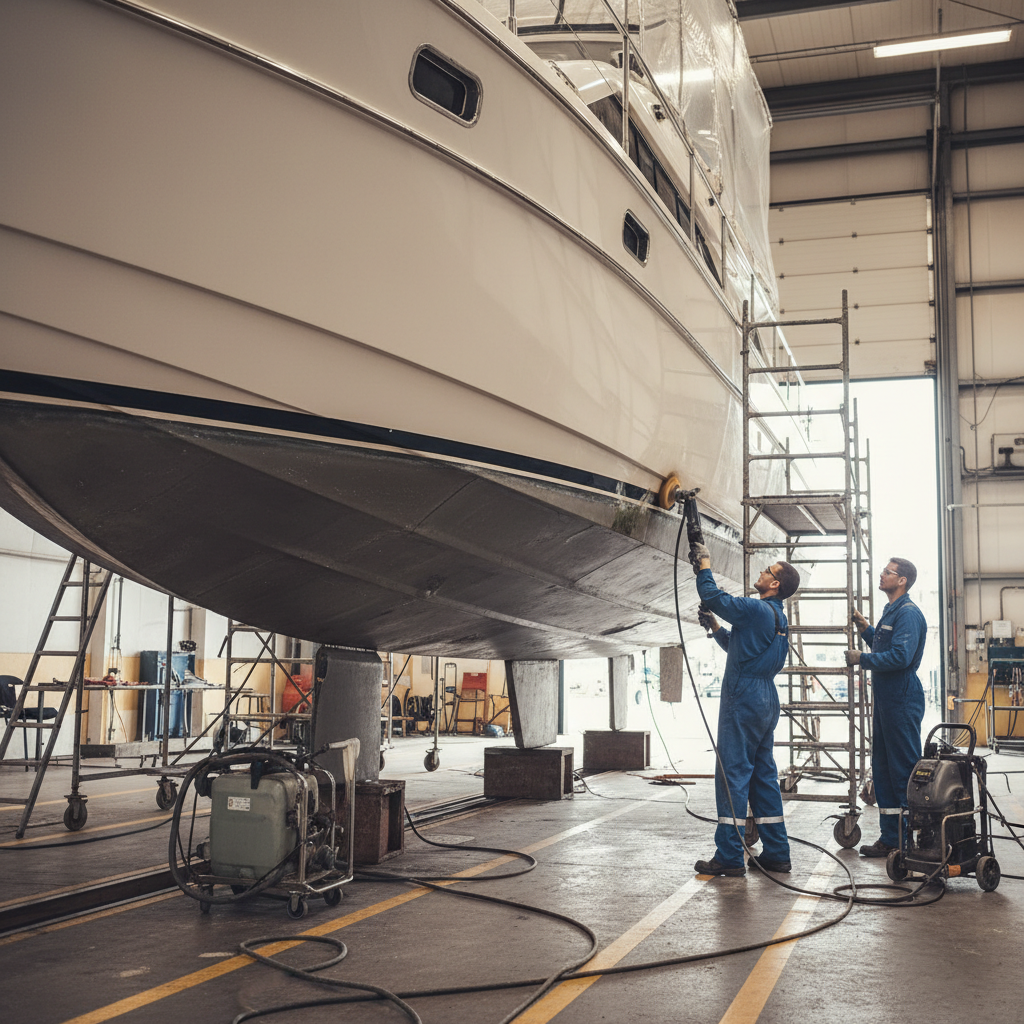
The real kicker? Many boaters ignore the running gear. A propeller with even light barnacle growth acts like a blender rather than a wing, losing its lift and efficiency. This is where the “stall” happens—you push the throttle forward, the engine roars, but the boat barely moves.
Optimizing for Fuel Efficiency and Engine Longevity
A comprehensive fuel efficiency audit should be part of your annual vessel strategy. According to the EPA’s guidelines on vessel maintenance, keeping a smooth hull is one of the most effective ways to reduce your carbon footprint on the water.
- Check your Zincs: Corrosion and growth often go hand-in-hand; if your sacrificial anodes are gone, your running gear is next.
- Review Your Bottom Paint: Not all paints are created equal for the San Francisco Bay’s unique current and temperature profiles.
- Document Everything: Before-and-after photos are the only way to ensure your dive team isn’t just “scrubbing air.”
If you’re noticing a decline in performance at the South Shore or near the Brisbane marina, it’s time to stop guessing. You can browse our hull cleaning guides to learn more about localized fouling patterns in the Bay Area.
The Data-Driven Diver: Beyond the Scraper
The future of marine maintenance isn’t just a guy with a brush; it’s integrated vessel performance monitoring. By combining diver observations with engine telemetry, we can help you move from reactive repairs to proactive grooming.
One contrarian insight we stand by: **You shouldn’t always clean to the metal.** If your diver is taking off clouds of paint every time they visit, they are shortening the life of your hull’s protection. We advocate for “grooming”—a gentler process that removes biofilm before it hardens into a hull roughness penalty that requires aggressive scraping.
Ready to reclaim your speed? Contact 360 Hull Diving today for a comprehensive assessment of your vessel’s underwater health and get the photo proof you deserve.
Frequently Asked Questions
How does marine growth friction affect my engine’s lifespan?
Increased friction forces the engine to operate at higher loads and temperatures to maintain cruising speeds. Over time, this leads to premature wear on internal components, increased carbon buildup, and potential failure of cooling systems. Regular cleaning reduces this mechanical strain significantly.
Can I perform a hull drag analysis while the boat is in the water?
Yes, by comparing your current RPM-to-speed ratio against your vessel’s baseline performance, you can estimate drag. However, a professional underwater inspection with photo documentation is the only way to confirm if the loss is due to biofouling or mechanical issues like a fouled prop.
Is a fuel efficiency audit worth it for a recreational boat?
Absolutely. With Bay Area fuel prices remaining high, a 15-20% improvement in efficiency pays for the cost of a dive service in just a few outings. Beyond fuel, the audit helps identify early signs of electrolysis and zinc depletion that could lead to five-figure repair bills.
What is the difference between micro-fouling and macro-fouling?
Micro-fouling refers to the initial layer of slime, algae, and bacteria. While it looks minor, it causes significant hydrodynamic drag. Macro-fouling involves hard growth like barnacles and mussels, which creates extreme friction and can physically damage hull coatings and intake grates.